Extended analysis of political cause and effect: how coalitions form and break, why a governing party loses support, where institutional design blunts a mandate. Arguments are built from results, roll calls and comparative cases. Intended for analysts, academics and readers who want reasoning instead of reaction.
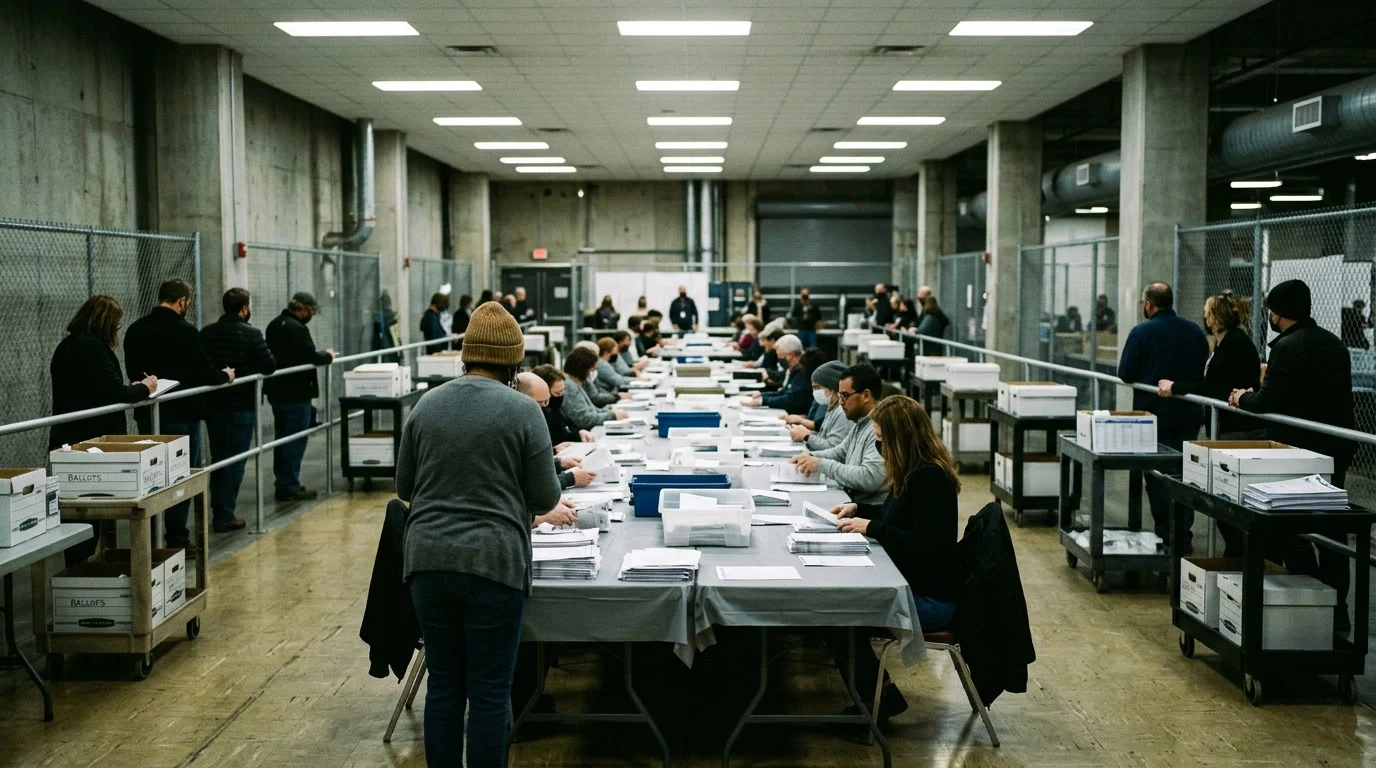
Twenty-six states and Washington, D.C. require a recount without a candidate asking for one, but the margin that triggers it, and who pays when it doesn't, differs by statute in every state that has one.
The legal fights now target the local officials who sign the canvas — and states have spent the years since 2020 rewriting the rules those officials operate under.
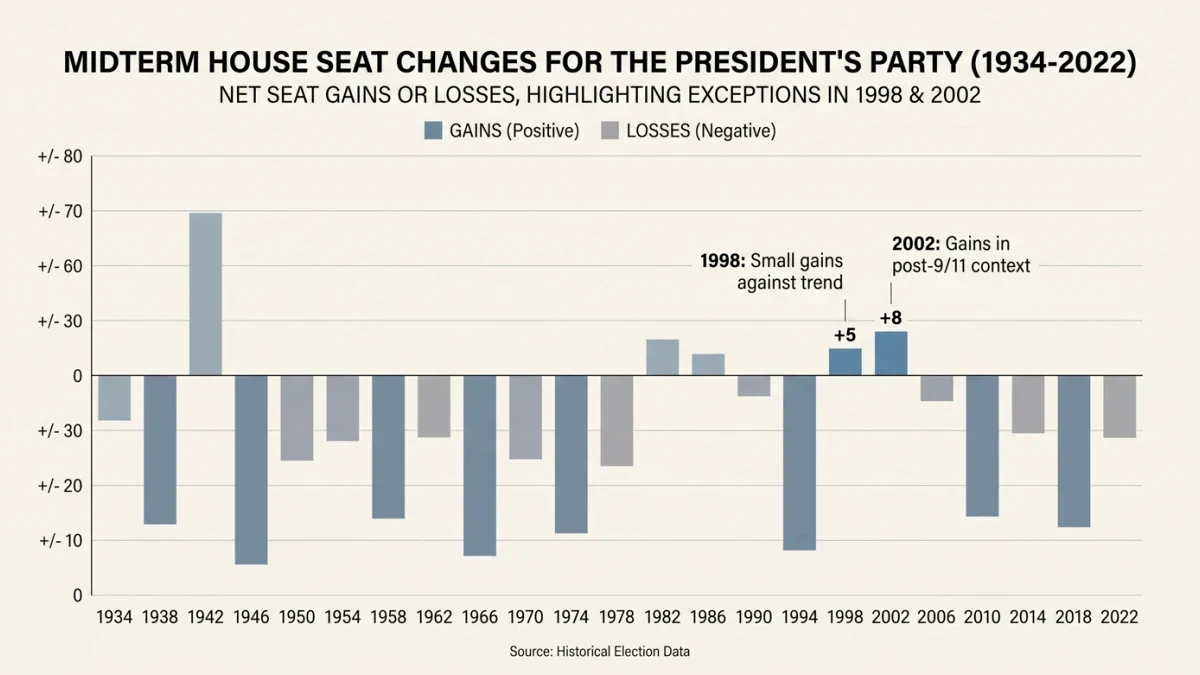
Since 1934 the president's party has lost House seats in almost every midterm — the exceptions are few and instructive, and the modern re-sorting of seats has flattened the old wave sizes.
Unitemized receipts are the most quoted and least understood line in campaign finance — the data can show breadth of support, but only the itemized detail shows who supplies it.